5 Results
[681.1.11.1] The results of the simulations are compared with experimental data
and
the most sophisticated model of [15] (previously
developed in [22, 17]) in
Fig. 3 and 4.
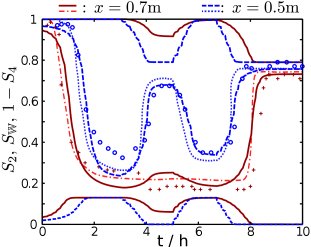
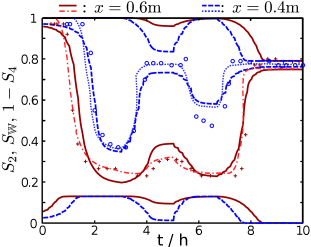
[681.1.11.2] Figure 3 shows the computed time evolution of ![]() ,
, ![]() ,
, ![]() at
at ![]() ,
,
![]() ,
, ![]() and
and ![]() as continuous and dashed lines.
[681.1.11.3] The experimental data for
as continuous and dashed lines.
[681.1.11.3] The experimental data for ![]() are shown as plus signs and
circles and the simulation results with the most sophisticated
model of [15] are represented by dash-dotted and
dotted curves.
[681.1.11.4] There is good qualitative agreement at all four positions.
are shown as plus signs and
circles and the simulation results with the most sophisticated
model of [15] are represented by dash-dotted and
dotted curves.
[681.1.11.4] There is good qualitative agreement at all four positions.
 |
 |
[681.1.12.1] During the first two hours of the experiment, the saturation decreases
because of the lowered pressure in the water reservoir.
[681.1.12.2] The instants at which the capillary fringe passes the measurement
points agree at all four points between simulation and measurement.
[681.1.12.3] The decrease in water saturation induces a production of non-percolating water.
[681.1.12.4] The corresponding decrease in non-percolating air is not visible in the graph
because of the small amount of initial non-percolating air.
[681.1.12.5] The pressure does not change between ![]() and
and ![]() .
[681.1.12.6] Hence, the rate of saturation change decreases
and saturation reaches an almost stationary value.
[681.1.12.7] The calculated water saturations of that plateau
are slightly smaller than the experimental ones.
[681.1.12.8] Measured and predicted values during the first increase of the reservoir pressure
at around
.
[681.1.12.6] Hence, the rate of saturation change decreases
and saturation reaches an almost stationary value.
[681.1.12.7] The calculated water saturations of that plateau
are slightly smaller than the experimental ones.
[681.1.12.8] Measured and predicted values during the first increase of the reservoir pressure
at around
![]() show good agreement excluding
show good agreement excluding
![]() .
[681.1.12.9] In contrast to the simulated saturation, the measured saturation
decreases at
.
[681.1.12.9] In contrast to the simulated saturation, the measured saturation
decreases at
![]() after an increase of the pressure at the lower boundary.
[681.1.12.10] This surprising effect was not
discussed in the experimental work [15] and the lack
of error bars makes an interpretation difficult (similar experiments
[16] by the same authors suggest error bars of order
after an increase of the pressure at the lower boundary.
[681.1.12.10] This surprising effect was not
discussed in the experimental work [15] and the lack
of error bars makes an interpretation difficult (similar experiments
[16] by the same authors suggest error bars of order
![]() ).
[681.1.12.11] The increase of water saturation induces a decrease
of non-percolating water and a production non-percolating air.
).
[681.1.12.11] The increase of water saturation induces a decrease
of non-percolating water and a production non-percolating air.
[681.1.13.1] The subsequent evolution of the saturation shows qualitatively similar phenomena upon changing the pressure. [681.1.13.2] Note, that the spatiotemporal evolution of the saturation requires an infinite number of scanning curves in traditional hysteresis modelling, i.e. when the process changes between drainage and imbibibtion as a function of time and position. [681.1.13.3] Here in our model a single set of parameters is sufficient, and there is no need to know scanning curves beforehand. [681.1.13.4] At the end of the experiment water is almost completely connected at all four measurement positions, while most of the air is disconnected and trapped. [681.1.13.5] The trapped air prevents the complete filling of the column with water and indicates the irreversibility of the process.
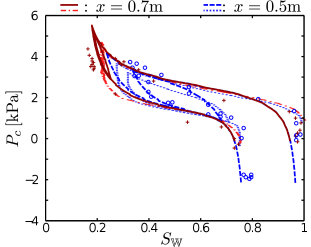
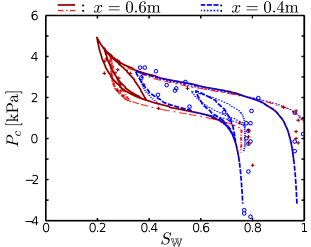
[681.1.14.1] Figure 4 illustrate the hysteretic drainage and
imbibition processes in the ![]() plane.
[681.1.14.2] It shows
plane.
[681.1.14.2] It shows ![]() obtained by eliminating
obtained by eliminating ![]() and
and ![]() from the measurements of
from the measurements of ![]() and
and ![]() at
at ![]() ,
, ![]() ,
, ![]() and
and ![]() .
[681.1.14.3] The lines of the simulations indicate the time evolution
which is compared to the time discrete observations in the experiment.
[681.1.14.4] Experimental and simulated data agree qualitatively.
[681.1.14.5] The values at
.
[681.1.14.3] The lines of the simulations indicate the time evolution
which is compared to the time discrete observations in the experiment.
[681.1.14.4] Experimental and simulated data agree qualitatively.
[681.1.14.5] The values at ![]() corresponds to the minimum in the pressure
protocol of the water reservoir (see Figure 1) at the start of the experiment.
[681.1.14.6] The decrease in water saturation induces an increase in
corresponds to the minimum in the pressure
protocol of the water reservoir (see Figure 1) at the start of the experiment.
[681.1.14.6] The decrease in water saturation induces an increase in ![]() during the
primary drainage and the curves of all four positions coincide with
the experimental data.
[681.1.14.7] The point with the lowest saturation of each primary drainage branch
corresponds to the instant when the pressure in the water reservoir is increased again.
[681.1.14.8] The deviations between simulation and experiment at
during the
primary drainage and the curves of all four positions coincide with
the experimental data.
[681.1.14.7] The point with the lowest saturation of each primary drainage branch
corresponds to the instant when the pressure in the water reservoir is increased again.
[681.1.14.8] The deviations between simulation and experiment at ![]() and
and ![]() originate from the mismatched saturations (see Fig. 3).
[681.1.14.9] The following imbibition discloses the hysteretic nature of the process
as the curves at the four different positions follow different scanning curves.
[681.1.14.10] Also the subsequent drainage yields different drainage scanning curves.
[681.1.14.11] This branch of the curve is difficult to identify in the experimental data
at
originate from the mismatched saturations (see Fig. 3).
[681.1.14.9] The following imbibition discloses the hysteretic nature of the process
as the curves at the four different positions follow different scanning curves.
[681.1.14.10] Also the subsequent drainage yields different drainage scanning curves.
[681.1.14.11] This branch of the curve is difficult to identify in the experimental data
at ![]() and
and ![]() but matches well at the other two locations.
The final imbibition yields saturation
but matches well at the other two locations.
The final imbibition yields saturation ![]() and the curves at all
four positions almost coincide again.
and the curves at all
four positions almost coincide again.
 |
 |
[681.1.15.1] The figures show that the quality of our results is comparable to the most sophisticated model used in [15]. [681.1.15.2] However, in our theory the hysteresis in saturation profiles is due to the natural assumption that breakup and coalescence rates are proportional to the rate and direction of saturation change, whereas in their models, the hysteresis is nonlocal in time and inserted directly by hand into the constitutive functions. [681.1.15.3] The good quality of the results is surprising because it is evident that some of our assumptions such as the incompressibility of air and the incompressible porous medium are questionable. [681.1.15.4] We remark also, that the lack of error bars for the experimental data makes an interpretation difficult.
